Call us: 905-922-1214

In today’s compliance landscape, every inspection number tells a story — about your fleet, your drivers, and your CVOR health. Yet too many carriers still treat inspection data as a “back-office” concern instead of a strategic business metric. The truth? Your CVSA inspection profile is your compliance fingerprint, and it’s shaping everything from insurance rates to roadside pull-ins.
Understanding the Six CVSA Levels of Inspection
The Commercial Vehicle Safety Alliance (CVSA) uses six standardized levels of inspection across North America. Each targets specific safety and compliance areas:
- Level I – Full Inspection
A 37-step deep dive: driver credentials, hours of service, vehicle components, brake performance, load securement, lighting, steering, tires, and more. This is the gold standard — and the one that influences your CVOR score the most. - Level II – Walk-Around Inspection
Focused on what can be checked without getting under the vehicle. Fewer touchpoints than Level I but still impacts your record. - Level III – Driver-Only Inspection
Paperwork and qualifications: licence class, medical, hours of service, daily inspections, and supporting documentation. A red flag here can mean immediate points against your CVOR. - Level IV – Special Study / One-Time
Conducted for research or enforcement trends (e.g., Brake Safety Week). Data from these can still ripple through your compliance profile. - Level V – Vehicle-Only Inspection
Often done at carrier facilities or after collisions; checks mechanical fitness without the driver present. - Level VI – Enhanced Inspection for Hazardous Materials
For select radiological or high-hazard loads. Extremely detailed and strictly regulated.
Why CVSA Inspection Results Matter to Your CVOR Rating
Every inspection — pass or fail — directly feeds your Carrier Safety Rating. In Ontario, that means your CVOR rating and overall risk profile are recalculated in real time.
- Too many Level I or II defects? You trigger higher intervention thresholds.
- Driver violations on Level III inspections? Your administrative control is questioned.
- No inspections at all? That can be just as risky — it suggests inactivity or avoidance, raising red flags for insurers and enforcement.
Carriers who actively monitor their inspection ratios (inspections per vehicle, out-of-service rates, defect trends) not only stay audit-ready but demonstrate a proactive safety culture to both MTO and insurers.
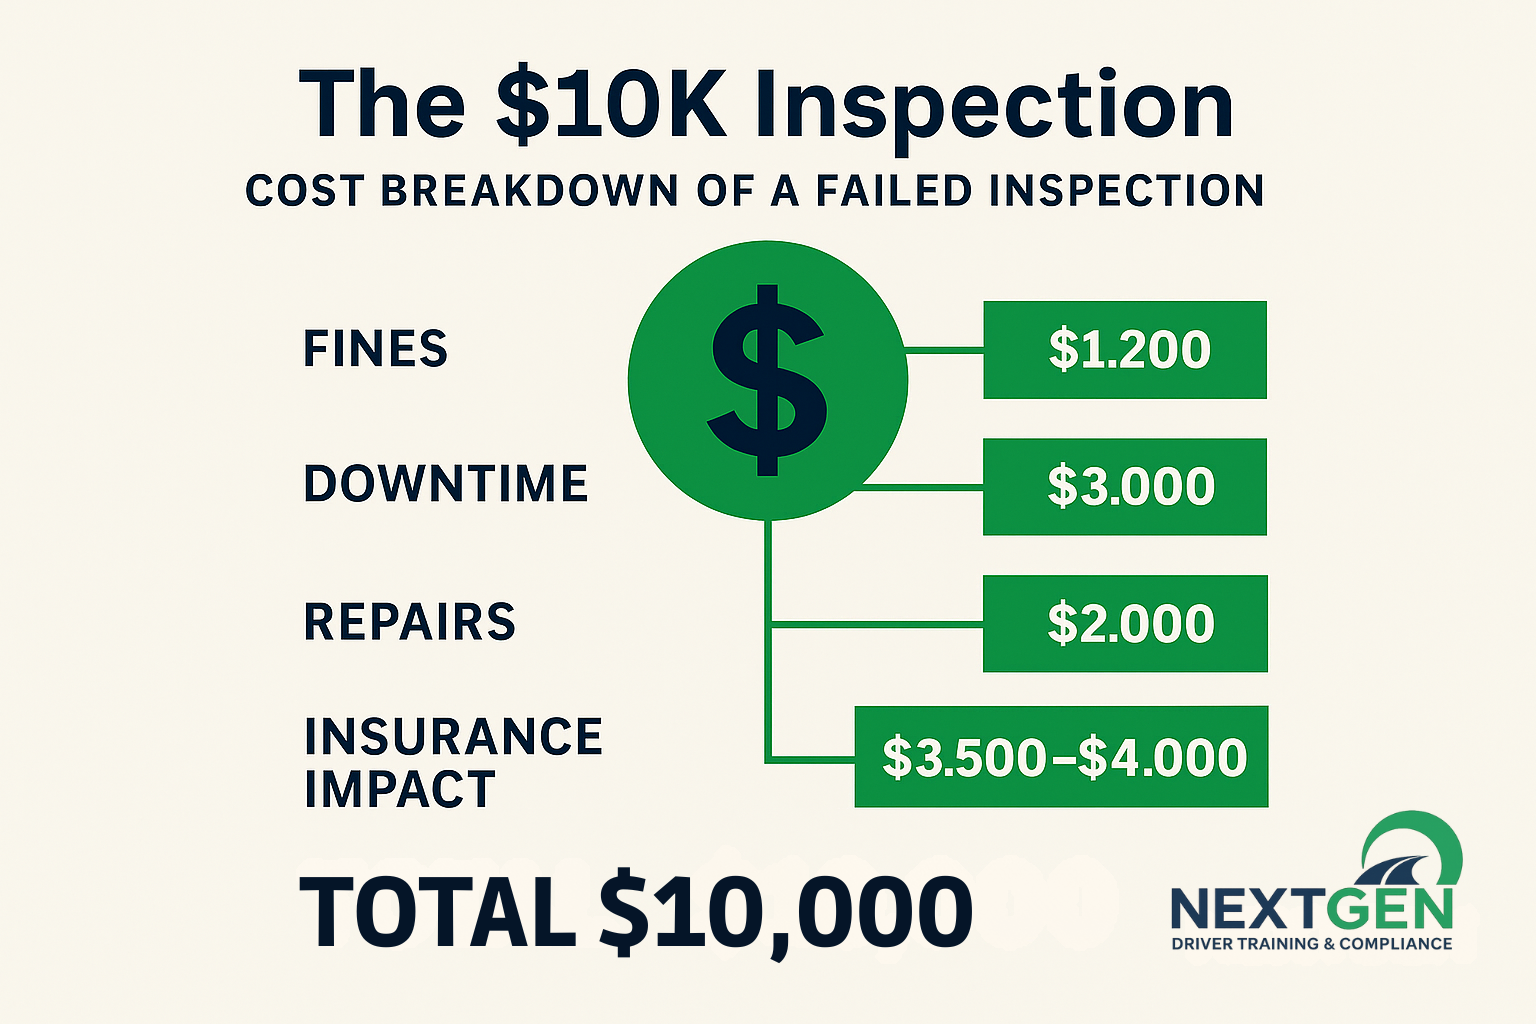
The Real Cost of CVSA Inspection Defects
When defects are found during a CVSA inspection, the cost extends far beyond a repair invoice or a citation. Each defect sets off a chain reaction that impacts your fleet’s bottom line and CVOR health.
1. Immediate Financial Impact
- Fines and citations: $200 – $1,000 per defect
- Out-of-Service (OOS) orders: $1,500 – $3,000 in lost productivity and delays
- Tow/roadside repairs: $500 – $1,000 per call
2. CVOR & Insurance Implications
Every violation is uploaded to your MTO CVOR record and FMCSA portal, influencing your overall safety rating.
Repeated findings can trigger audits or a Conditional rating, while insurers track the same data — potentially increasing premiums by 5–15 % and disqualifying you from Platinum or Elite tiers.
3. Operational Ripple Effects
- Delivery delays damage customer confidence
- Drivers lose morale when they see unprepared units
- Management time and repair costs surge post-incident
In the 2025 CVSA “International Roadcheck” report, Canada (including Ontario) had an out-of-service (OOS) vehicle rate of 22.6% of inspected vehicles. Trucknews
Benchmarking CVSA Inspection Data to Improve CVOR Performance
At NEXTGEN, we track a key metric:
“Defects per 10 Inspections.”
A fleet running above 1.5 defects per 10 is trending toward Conditional-risk territory. Elite fleets — the ones in “Excellent” status — maintain below 1.0, supported by disciplined pre-trip inspections and near-miss reporting.
This is where data meets behavior. When drivers understand that every inspection outcome contributes to the company’s CVOR score, accountability becomes part of the culture — not a paperwork exercise.
Transforming Inspections into Insight
Smart carriers treat CVSA inspection data as predictive analytics — identifying weak links before they escalate into audit findings.
NEXTGEN’s Mock CVOR Audit process reviews your inspection frequency, defect clusters, and OOS orders to pinpoint where compliance risk is trending.
Our clients who implement inspection analytics and targeted training programs typically see:
✅ 20–30 % reduction in OOS violations
✅ Improved insurance ratings
✅ Positive trendlines in CVOR performance indicators
Takeaway
Your CVSA inspection results are more than roadside data — they’re your compliance currency.
Monitoring trends, engaging drivers, and aligning policies with inspection outcomes is how top fleets earn and maintain that coveted Excellent CVOR Rating.
NEXTGEN Driver Training & Compliance
“Raising the Standard in Trucking Safety & Compliance.”